
1. Opening: why do you need this tool?
A WeChat official account editor stares at 200 rows of survey data in a spreadsheet and has to ship a long-form piece with five charts by 8 a.m.; a product manager needs the Q3 weekly report turned into a visualization where the boss can read ranking, change and outliers within 10 seconds; a researcher writing a paper wants every tick and every percentage point to map back to a real sample unit instead of being buried under gaudy gradients and 3D bars. All three share one pain point: an AI Agent can spit out chart code, but the visual grammar behind that code is chaos — colors picked at random, units dropped, whitespace arbitrary, animation piled on. The result looks viewable but is unreadable. Lieflat Charts exists to fix exactly that.
2. What it is, in one sentence
Lieflat Charts is a data visualization Skill in the Agent Skills format, designed for AI Agents so they can turn raw data into polished, interactive, editorial-feeling HTML charts quickly. It ships 49 chart templates split across two reading speeds — slow reading and fast reading. The repo has 635 stars, and version 2026.8.6 adds color modes (Porcelain blue, Palm green, Wire red) plus support for any SKILL.md-compatible agent such as Moxt, Claude Code and Codex.

3. Core features in depth
1. A visual system for two reading speeds: Lupi and Glance
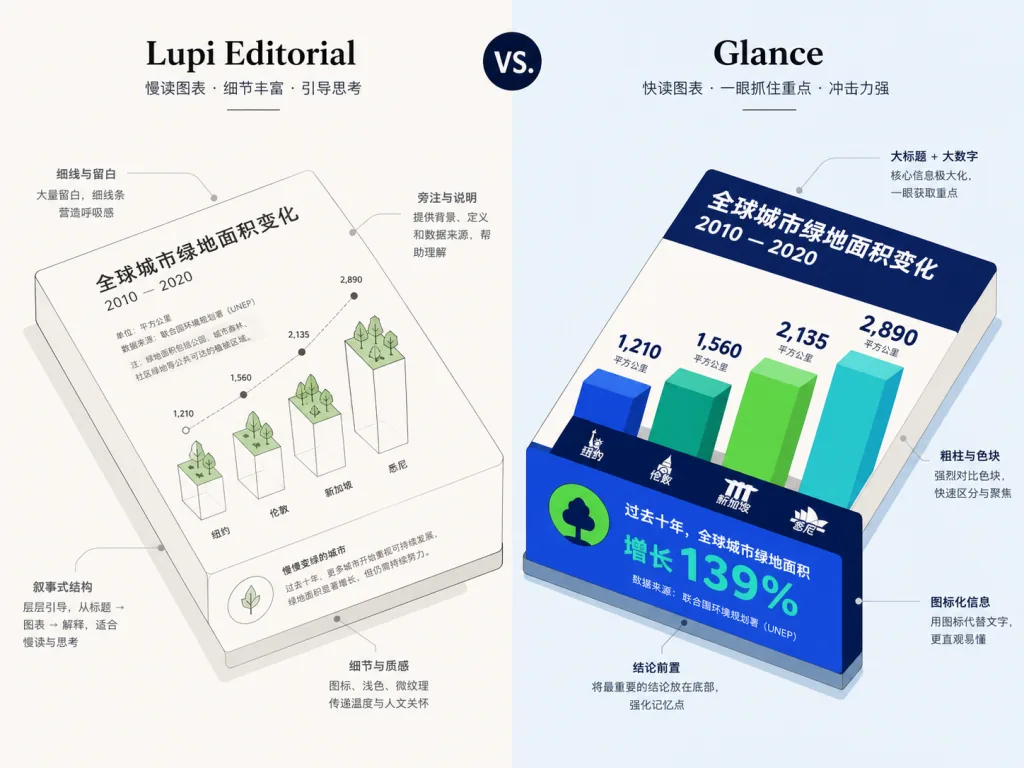
Lieflat Charts sorts charts into two reading scenarios. The Lupi series (Editorial and Basics) targets readers willing to spend 30 seconds or more: hairline rules, whitespace, ledger-style guides and marginal notes map every data point to a real unit, which suits annual reports, papers and long-form WeChat articles. The Glance series targets the 10-second read: thick bars, big numbers, color blocks and explicit ordering aggregate the information up front so readers catch highs, lows, change and outliers in seconds — a fit for weekly reports, decks and dashboards. Both systems share one Mono visual grammar (paper gray, charcoal black, a mid-gray ramp), so they never fight each other.
2. 49 chart templates plus a data-contract index
The project offers 49 charts: 15 Lupi Editorial, 13 Lupi Basics, 18 Glance and 3 Interactive set pieces. Each chart has its own data-contract entry in catalog.md, and the agent first decides what question the chart must answer, then picks the chart type, and only then draws. That is the reverse of the usual chart-library logic of grabbing a template and stuffing data into it.
3. Three color presets plus a Custom palette
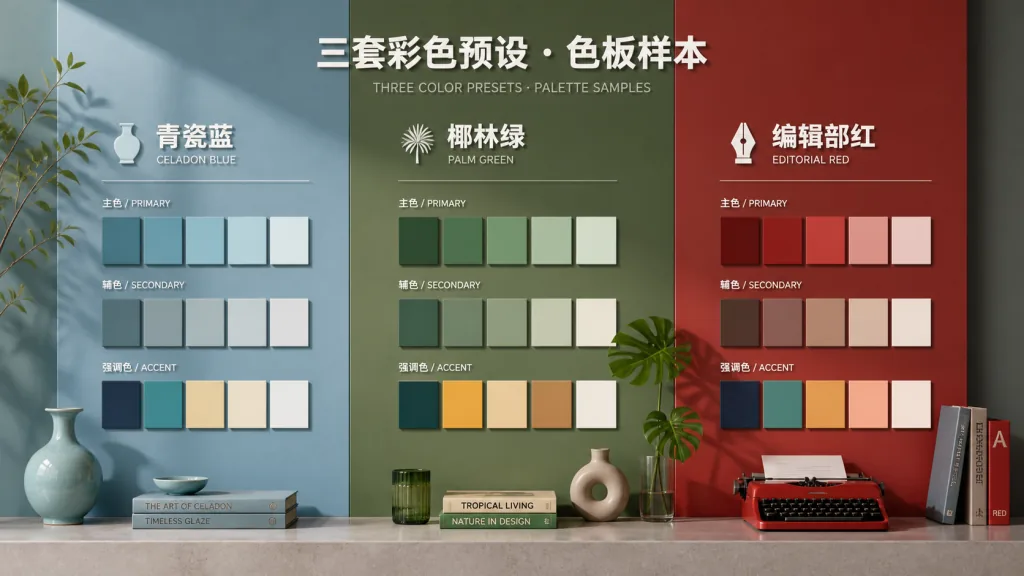
The 2026.8.6 release adds color modes. Porcelain blue suits ordered data and single series; Palm uses a low-saturation green-yellow range to separate a handful of unordered categories; Wire adds one fluorescent orange focal point on black and grays for controlled emphasis. The agent picks the color system from the data structure, and when you hand it a brand color or hex value it can build a Custom palette that still clears contrast requirements. One HTML file or chart group uses one color system only, which keeps visual noise out.
4. Real units as visual atoms
Lieflat Charts insists that one cell is one percentage point, one tick is one person, one hairline is one day. It refuses decorative gradients, shadows and 3D effects that fake density, and instead treats title, marginal notes, sources, whitespace and motion as parts of the chart. That makes the output readable inside a long WeChat article and strong enough to stand alone as a visualization poster.
4. Technical highlights and performance data
The architecture centers on mono-tokens.js (shared visual tokens) and color-presets.js (the three built-in color presets); every template shares the same design tokens, which keeps visuals consistent across chart types. Implementation is layered: Lupi Editorial is hand-written SVG throughout, Lupi Basics is hand-written SVG for simple cases with F13 Treemap on ECharts, the Glance series loads Chart.js or ECharts from a CDN, and the Interactive set pieces (Force Graph, Circular, Path) are likewise built on ECharts / SVG. A scripts/validate.mjs pre-publish check script makes sure templates render correctly both offline and online.
Against comparable Agent Skills, the differentiator is the decision flow: judge the data contract first, then choose the chart type. This is not a template collection but a complete visual grammar that folds chart selection, editorial layout, browser interaction and full-page narrative into one reusable Skill.
5. Scenarios and who it fits
Scenario one: long-form WeChat articles and annual reports. An editor or independent writer has survey data or an annual-report PDF and needs five charts with Chinese labels that each land an independent conclusion. Lupi Editorial templates, with the Porcelain or Wire preset, are the fit.
Scenario two: weekly reports and decks. A product or operations manager needs the boss to read ranking, change and outliers in 10 seconds. The Glance series, with Palm to separate categories or Wire to highlight key metrics, works here.
Scenario three: papers and academic publication. A researcher wants every tick and data point tied to a real sample unit, with countable scales preserved. Hand-written SVG templates from Lupi Basics or Lupi Editorial suit this, and they export to vector easily later.
Who it fits: heavy AI Agent users, WeChat editors, data analysts, product managers, researchers. Who it does not: enterprises needing a purely commercial closed deployment (the project uses the PolyForm Noncommercial License 1.0.0, so commercial use needs a separate license); and situations with a hard chart quota that the data can only support 1–2 conclusions for (the Skill will not repeat one conclusion just to fill space by default).
6. How it compares
| Dimension | Lieflat Charts | General chart library (Chart.js / ECharts) | Other Agent Skill chart templates |
|---|---|---|---|
| Visual grammar | Unified Mono plus three color presets, consistent across chart types | Default theme only, you customize | Usually one style, no system |
| Data contract | Judge the question → pick the chart type, 49 indexed entries | User picks manually | Usually no index |
| Reading speed | Lupi (slow) and Glance (fast) together | Single speed | Single speed |
| Unit fidelity | Every visual element maps to a real data unit | Plenty of decoration | Depends on the project |
| Agent integration | Native support for Moxt, Claude Code, Codex | Needs manual wrapping | Partially supported |
| Commercial licensing | PolyForm Noncommercial (license required) | MIT / Apache 2.0 | Depends on the project |
7. Getting started fast
Recommended: use it inside Moxt. Lieflat Charts was designed, tested and iterated in Moxt, where the agent can read the full design spec, call templates and keep previewing in the same workspace. Head to Moxt Hub and enable it in one click.
Install into another agent: in Claude Code run npx skills add https://github.com/larashero3-dotcom/lieflat-charts --skill lieflat-charts; Codex users point the path at ~/.codex/skills/lieflat-charts.
Minimal working example: after installing, tell the agent:
Turn this survey data into five Chinese-language charts for a long-form WeChat article. Compare Lupi Editorial and Lupi Basics candidates first by default; only fall back to Glance when neither fits.
The agent reads SKILL.md, catalog.md and templates/ on its own and produces HTML charts that follow the visual grammar.
Further suggestions: ① one chart per question, 2–3 charts for 2–3 conclusions, 4–6 for a full article, six per page by default at most; ② when you want color, say "color style" explicitly or name a brand color, and the agent picks a suitable preset; ③ for an interactive set piece (Force Graph), just say "I need a draggable network graph".

8. Takeaways and what to do next
The core value of Lieflat Charts is upgrading "an AI Agent can draw charts" into "an AI Agent draws charts with a consistent visual grammar". It fixes the two things data visualization most easily ignores: visual consistency and data fidelity. Whether the output is a long WeChat article, a weekly dashboard or an academic paper, this Skill makes your charts both viewable and readable.
How to use it: ① try it in Moxt first, zero config; ② with lots of data and many conclusions, reach for Lupi Editorial; ③ for fast reading, go straight to Glance; ④ when you need color, let the agent choose, and specify a brand color only when necessary.
Project links:
- GitHub: https://github.com/larashero3-dotcom/lieflat-charts
- Try it on Moxt: https://moxt.ai/zh-CN/hub?view=skill?id=lieflat-charts
- Docs:
SKILL.md,catalog.md,mono-tokens.js
One-line pitch: if you are tired of AI Agents producing charts with random palettes, missing units and careless whitespace, Lieflat Charts is the Skill that gives data visualization its editorial feel back.