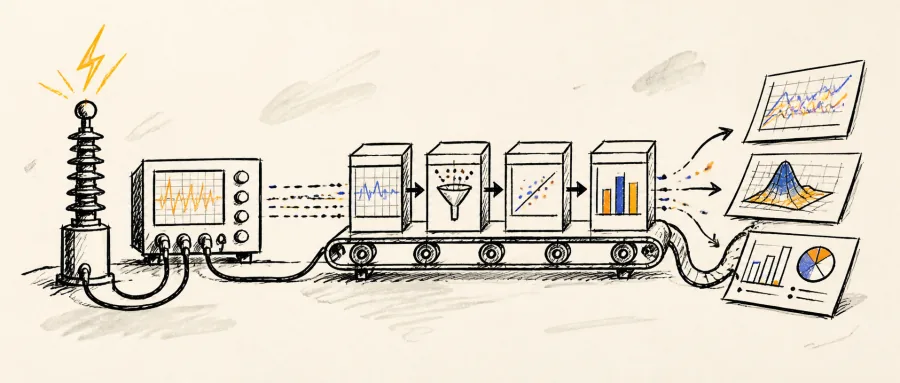
1. Stop fighting the tool by hand
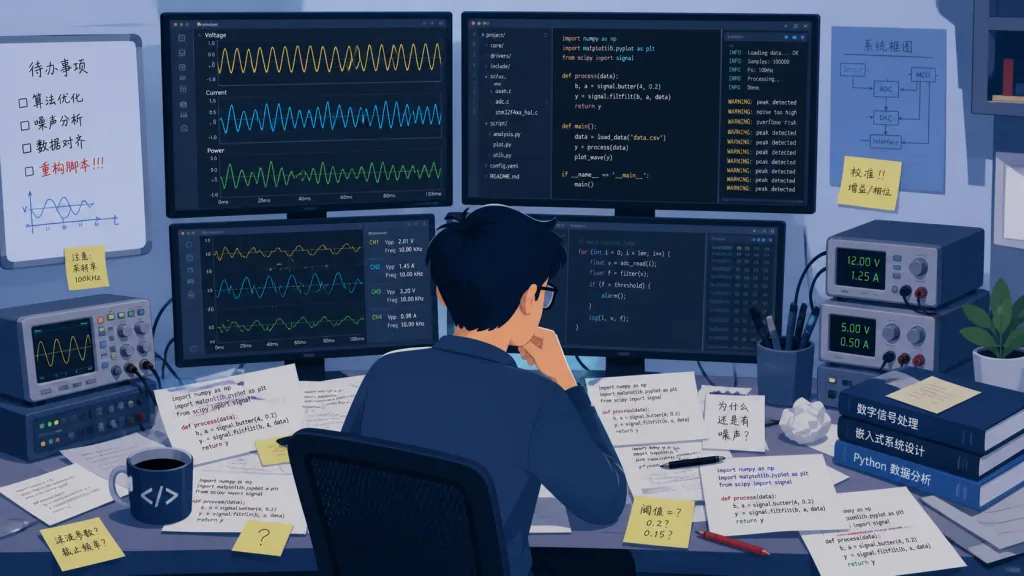
Anyone doing high-voltage analysis has almost certainly been here: you have a pile of waveform data, and you need statistical analysis, feature extraction and report output — only to find most of your time goes into stitching scripts together, cleaning files and converting formats. You write a mountain of code, spend all morning debugging, and end up with a single table. A colleague asks "does that script from last time still run?" and you can only smile wryly: it runs, but you have to change the paths, the parameters and the units.
That loop of "starting from scratch every time" is the core problem hv-analysis wants to solve.
2. What problem it solves
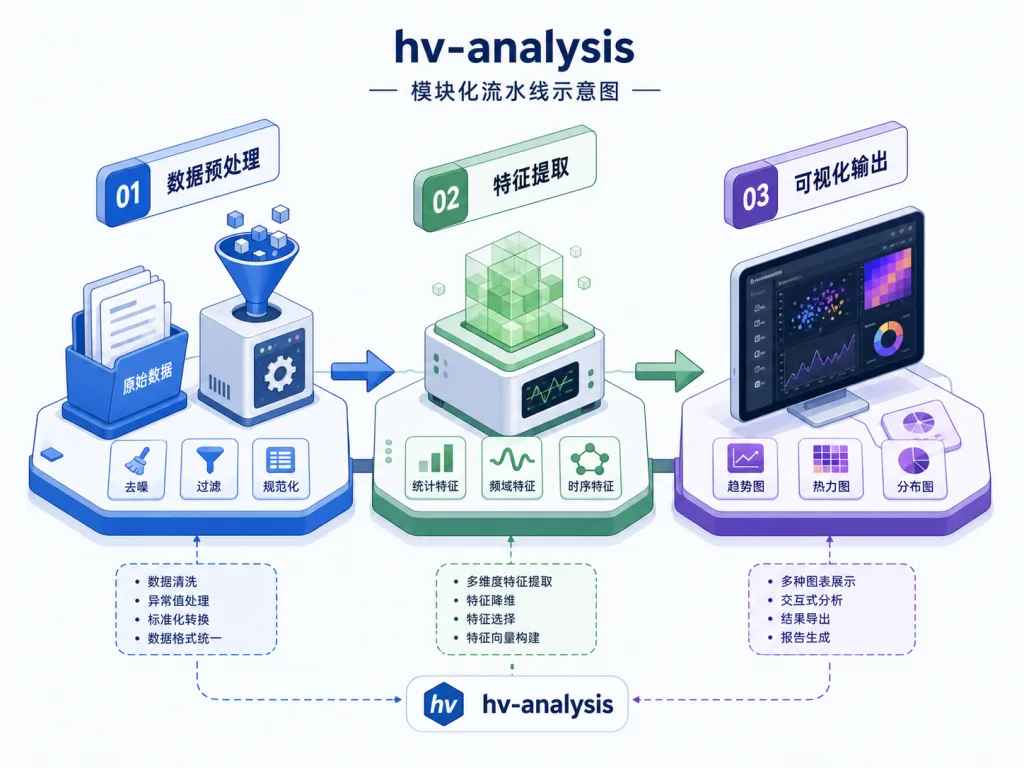
hv-analysis is a toolkit assembled around the data analysis needs of the high-voltage field. Its goal is to collapse scattered scripts and repeated manual work into a reusable analysis pipeline. It emphasizes three keywords: reproducible, extensible, workflow-ready. In other words, you no longer write code from zero for "the same kind of analysis" every time; instead you compose the analysis capability you need from the project's modules.
The repository is still at an early stage (0 stars), but the author positions it as a "battle-tested toolbox" rather than a "demo". Its module structure is designed around real engineering scenarios, so it is meant to be used directly.
3. A close look at the core features
1. Waveform data preprocessing
The project ships normalization for formats commonly encountered in high-voltage testing: sample-rate alignment, channel merging, anomaly-segment truncation, denoising and more. This is usually the starting point of every downstream analysis, and hv-analysis abstracts it into a unified interface so every script doesn't rewrite the parsing logic again.
2. Feature metric extraction
Peak value, rise time, duration, integrated energy, statistical histograms — these metrics recur constantly in high-voltage work, and hv-analysis turns them into configurable extractors. You specify the list of metrics you care about and the tool returns the results in one pass instead of you computing each one by hand.
3. Report and visualization output
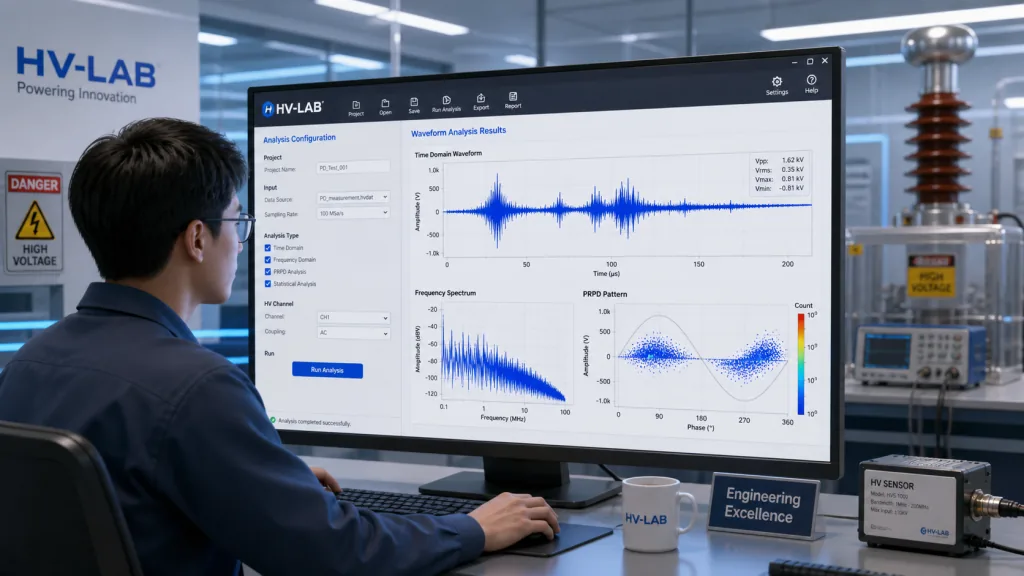
What you have to deliver after the analysis is usually a report with charts. hv-analysis provides templated visualization output — waveform plots, statistical distributions, comparison charts — and the results can be embedded directly into a document or exported.
4. Pipeline orchestration
This is the biggest difference from "a pile of loose scripts". hv-analysis lets you chain preprocessing, feature extraction and visualization into a single Job executed from configuration. That turns analysis into "filling in config" instead of "writing the flow".
4. Technical highlights and performance numbers
The project takes a "light dependencies, composable" route overall. Modules are cleanly decoupled: a single feature can be called on its own or chained into a pipeline, which reduces the maintenance cost of "change one line and everything moves".
For data processing, it is parallelized for the batch-file scenarios common in high-voltage testing, so analyzing a set of experimental data takes noticeably less time than serial scripts. Configuration is declarative — the config file is the analysis plan — which makes version control and team reuse straightforward.
On ecosystem compatibility, it is not tied to a specific database or filesystem. It reads common CSV / binary / instrument-export formats directly and slots easily into existing test pipelines.
5. Where it fits and who it's for
Scenario one: daily lab data processing. A test engineer's daily batch of waveform data can be fully processed with one configured run of hv-analysis.
Scenario two: reproducing research projects. When a paper or project needs historical experiments repeated, hv-analysis's reproducible design makes review and team collaboration smoother.
Scenario three: teaching and training. University courses and corporate training need an analysis framework students can run, understand and modify — this project fits exactly.
Who it suits: engineers, researchers and technical support staff in high voltage, power electronics, pulsed power, plasma and related fields.
Who it doesn't: people interested in real-time control systems themselves — this project targets offline analysis and does not cover real-time acquisition.
6. Comparison with alternatives
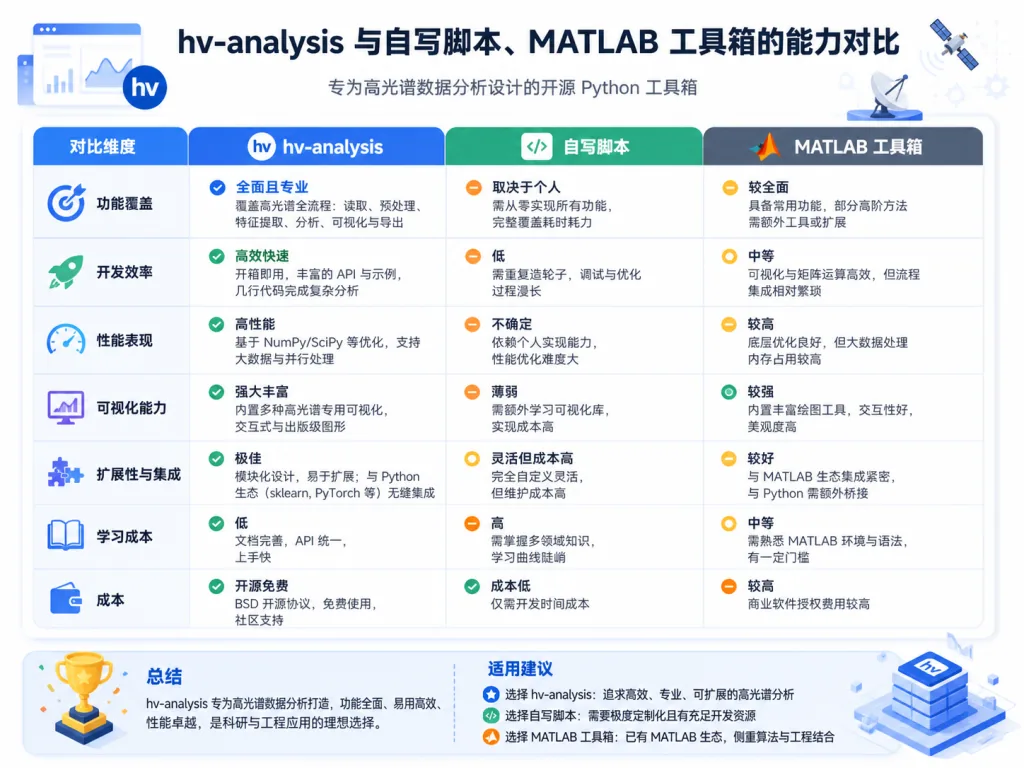
| Dimension | hv-analysis | Writing your own scripts | MATLAB toolboxes |
|---|---|---|---|
| Reusability | High, modular composition | Low, rewritten each time | Medium, license-bound |
| Cost of reproduction | Low, config file is enough | High, depends on personal coding habits | Medium, depends on the runtime environment |
| Entry barrier | Low, declarative config | — | Medium, needs a license and a learning curve |
| Collaboration friendliness | High, versioned config | Low, scripts scattered | Medium |
Compared with "build your own scripts and stitch them together", hv-analysis turns the analysis process into engineering. Compared with commercial toolboxes, it is more open and more extensible.
7. How to get started fast
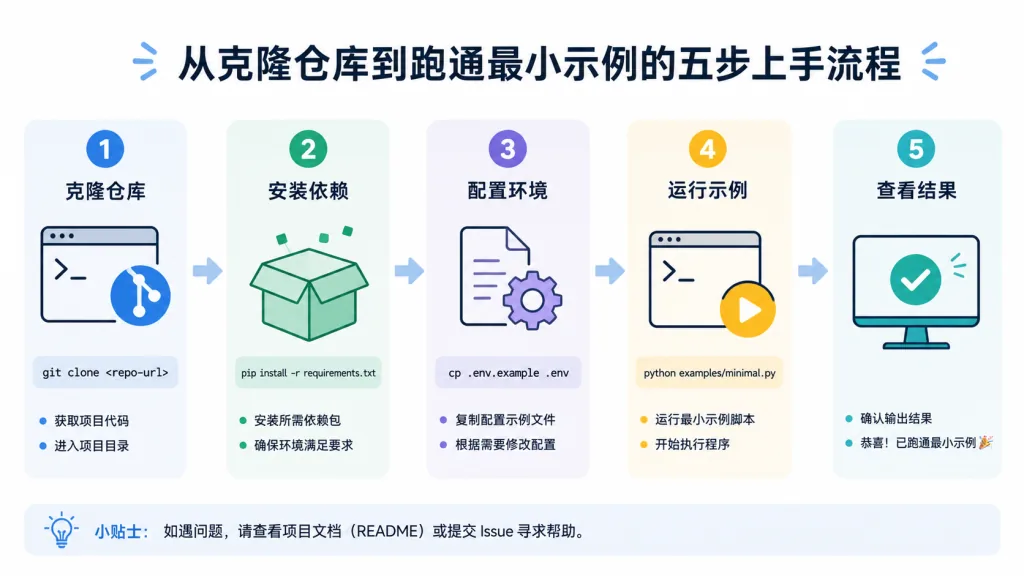
- Clone the repository:
git clone https://github.com/KKKKhazix/khazix-skills.git, then enter thehv-analysisdirectory. - Install dependencies: following the project's
requirementsor docs, install the usual Python ecosystem dependencies (numpy, pandas, matplotlib and so on). - Prepare data: arrange your waveform data in the input format the project expects (usually CSV or a designated directory).
- Run the minimal example: use the demo config the project provides and run the full preprocessing → feature extraction → report output flow.
- Extend as needed: add custom metrics or custom visualization templates to the config, gradually replacing your existing ad-hoc scripts.
Advanced tip: treat the project as your team's "analysis foundation" and build every hv-related analysis on top of it. The long-term payoff beats one-off scripts.
8. Takeaways and next steps
hv-analysis's core value is moving the messy offline analysis of the high-voltage field from "people writing code" to "configuration-driven". It lets you spend less time maintaining scripts and more energy on defining metrics and interpreting results.
If repeated waveform data processing is wearing you down, it is well worth spending half a day getting it running — this kind of tooling project is usually the "can't go back once you've used it" type.
Project link: https://github.com/KKKKhazix/khazix-skills/tree/main/hv-analysis — worth a try.