Pick a title (choose 1 of 3)
Mac stuttering with no proof? Try this 910-star open-source recorder
Make stutter "playback" for free: a hands-on guide to Mac Performance Monitor
Rewind history without Activity Monitor: an open-source menu bar performance tool
Mac keeps stuttering? Try this open-source menu bar tool: Mac Performance Monitor
1. Introduction: if only a tool could do this one step for you…
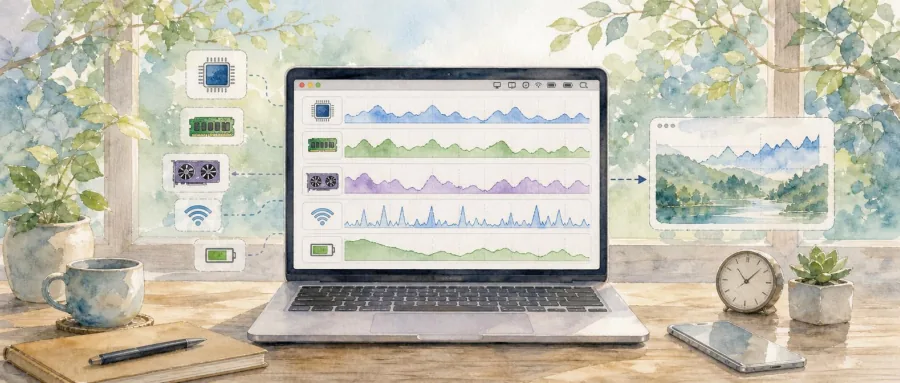
Have you been here? You're halfway through writing code and the fans suddenly spin up. You export a video and the progress bar freezes while the Mac gets hot enough to warm your hands. The battery says 60% and the system claims "2 hours remaining". You want to know who is eating your resources, but all you can do is open Activity Monitor and glance at an instantaneous reading — and once it's gone, there's no history to check.
There is no shortage of macOS performance tools, but they're either expensive, upload your data to the cloud, or only show data without recording it. By the time you want to review "that one stutter", the evidence is long gone. Mac Performance Monitor (MPM from here on) targets exactly this pair of needs: see the Mac as it is now, and get back to the scene as it was.
2. Project overview: what it actually is
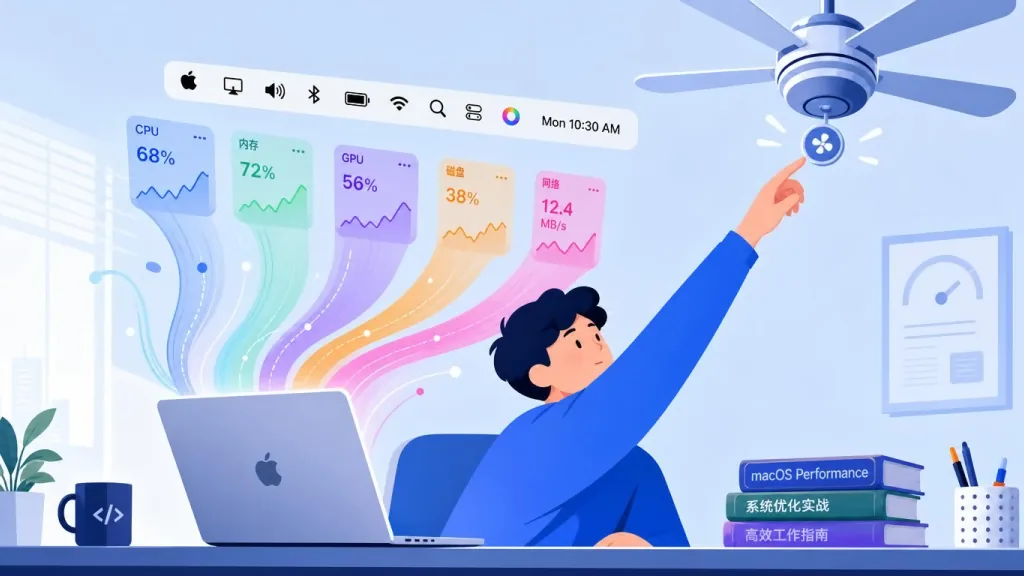
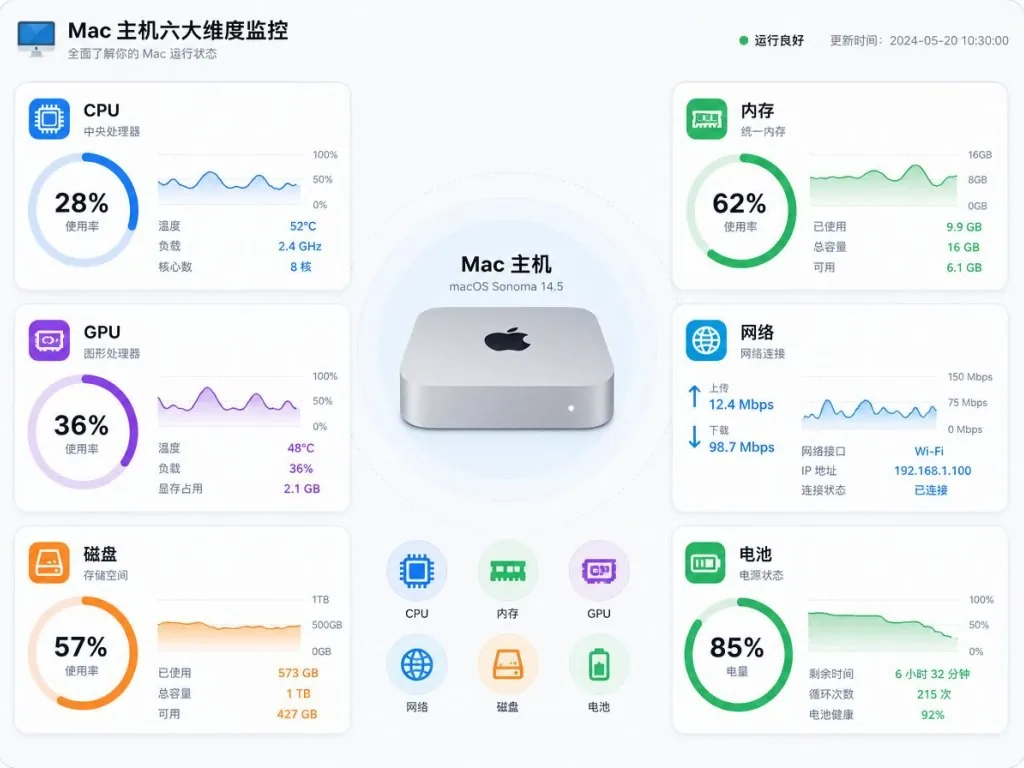
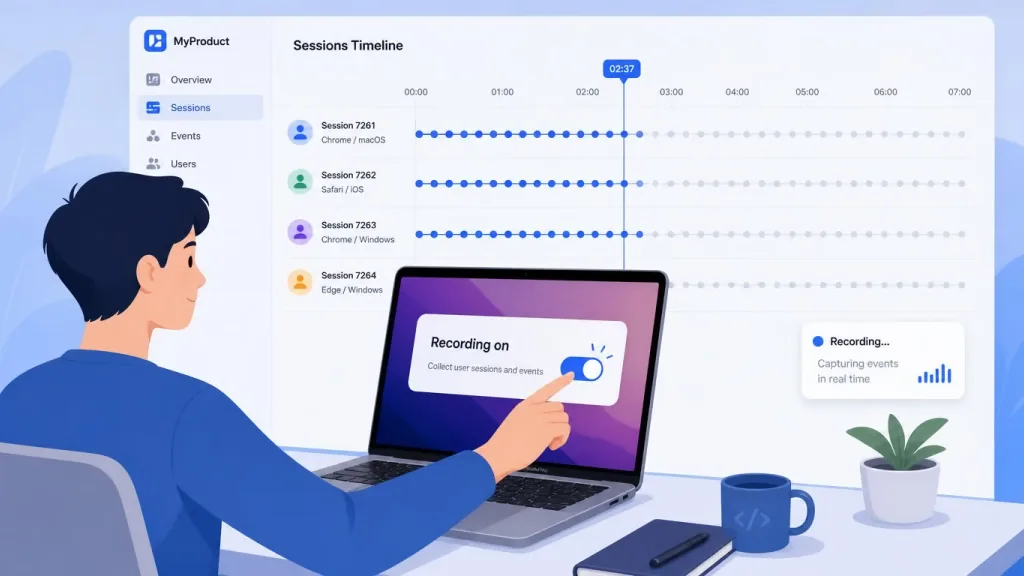
Mac Performance Monitor is a native macOS performance monitoring and recording tool written mainly in Swift, with 910 GitHub stars. It lives in your menu bar and covers six dimensions — CPU, memory, GPU, network, disk, battery and sensors — persisting every sampled frame to a local database so you can "go back to the moment the problem happened."
Four core keywords: Native, Recorder, Local-first, OSS. Version 2.2 adds GPU historical bandwidth, an Ask local Q&A preview, a process usage timeline and saved time ranges; it is notarized by Apple and supports macOS 15+ on Apple Silicon. A Homebrew Cask install is also available: brew install --cask mac-performance-monitor.
3. Core features in depth
1. Explorer: drag that moment back in front of you
Explorer is the centerpiece of 2.0: pick a point in time, drag in the metrics you care about, and compare up to 8 processes side by side — even ones that have already quit. Hovering shares a cursor across all charts; hold Command to bookmark and scroll the wheel to zoom around the pointer, while plain scrolling still scrolls the page. Click to "pin" a moment so you can line it up against source values, timestamps, known limits and stored machine data.
Traditional tools are good at "now" and have nothing for "back then". Explorer's difference: zooming never invents detail — old data keeps its original resolution, new data is recorded under new rules, so the shape of history stays stable.
2. Change-based alerts, not fixed thresholds
Plenty of tools fire an alarm the moment swap "looks big", which in practice means "it yells until you turn it off." MPM 2.0 introduces adaptive alerting rules: it looks at whether swap is persistently growing, whether it's causing paging pressure, and whether it's still getting worse — so a single spike no longer nags you repeatedly.
The process growth check rejects stale readings and growth that has already flattened out; minor issues are logged silently instead of being labelled a "memory leak." A separate "rapid growth" check catches runaway processes without waiting 20 minutes. Alert state is entirely local and independent of full history recording.
3. Ask local Q&A and AI agent collaboration
Ask About This Mac, new in 2.2, lets you ask in plain language — "why did my Mac get slow?" — or click directly on the Memory or Battery cards. MPM reads its own measurements and history first, then hands them to the macOS 27 on-device model to explain in everyday terms, attaching a link to the relevant chart after each conclusion. No data leaves the Mac at all, and regional summaries still work even with Apple Intelligence turned off.
Harder questions can go to AI agents like Claude Code or Codex: MPM ships a read-only MCP server, connected with a single command:
claude mcp add --scope user mac-performance-monitor -- "/Applications/Mac Performance Monitor.app/Contents/MacOS/mpm" mcp
Run mpm help for CLI usage. The agent reads your recording history — whatever you give it is what it sends, and that boundary is written into the docs.

4. Full-spectrum monitoring: every degree and every watt as a curve
- Processes: sorting, filtering, per-process CPU/memory history, file descriptors, disk I/O, Rosetta status; right-click for Usage Timeline to see sampling run history.
- Power: battery health, charging, power flow, temperature, fans, top energy consumers; since 2.1 all six power cards expand into full charts, and Health and Cycles keep years of daily history per battery.
- Network: up/down throughput, interface details, per-app traffic tracking.
- Disk: throughput, IOPS, service time, drive health, volume space, top I/O processes; Disk Map offers a treemap scan with quick preview.
- GPU: device and per-process activity, power draw, VRAM, thermal limits; 2.2 brings GPU memory and awake time into recording, with ANE Time/ANE Power as separate charts.
- Hardware: a searchable inventory of chip, memory, displays, storage and peripherals, refreshable on demand or exportable as a report.
5. Privacy and signing
MPM explicitly uses no usage analytics or telemetry; recordings and alert evidence stay on the machine. Only CSVs, trace files, reports and screenshots you export leave your Mac. Update checks, model downloads, signed content downloads and network tools make requests, but never upload recording history. The installer is Developer ID signed and Apple notarized, and updates go through Sparkle.
4. Technical highlights and performance data
- Swift 6 + Apple Silicon native: core build and tests are based on Swift 6; the app bundle requires Xcode 27 for App Intents and the macOS 27 SDK, and runs on macOS 15+ Apple Silicon.
- GRDB.swift + Sparkle ecosystem: storage on GRDB.swift (MIT), auto-update via Sparkle (MIT), local inference reusing MLX and llama.cpp.
- Localization-first: built-in English, Simplified Chinese, German and French, translated collaboratively through Crowdin; new strings are machine-translated first and wait for native-speaker review.
- Adaptive alerts: growth-based rules replace fixed thresholds, avoiding fatigue from alarms that never stop; alert state is decoupled from history recording.
- Multilingual CLI:
mpm helpexposes a command-line entry point, and the MCP server lets AI agents read history in a read-only capacity.
5. Use cases and audience
Good fit:
- Developers and ops folks who have long suffered "the Mac stutters but I can't prove it";
- Users running local LLMs (Ollama / MLX / LM Studio) who want to compare GPU and ANE power draw;
- Laptop users tracking battery health who want to separate "short spikes" from "long-term degradation";
- Privacy-sensitive teams that want to hand a snapshot to an AI agent without putting data in the cloud.
Not a great fit: light users who just want a CPU percentage (Activity Monitor is enough), and older machines stuck on Intel Macs or macOS 14 or earlier (the floor is macOS 15 + Apple Silicon).
6. Competitive comparison
| Dimension | Mac Performance Monitor | iStat Menus | Activity Monitor | Etar Mac |
|---|---|---|---|---|
| Price | Free and open source | Paid | Bundled with the OS | Free and open source |
| History recording | Built in, adjustable sample rate | Instantaneous only | Instantaneous only | Basic |
| AI/agent integration | Local Ask + MCP | None | None | None |
| Privacy | No telemetry, local storage | Closed source | Closed source | Depends on implementation |
| Notarization | Developer ID + notarized | Yes | OS component | Depends on implementation |
MPM's differentiation is "free + history + local AI + MCP", doing both "see it now" and "get back to it" thoroughly.
7. Getting started
Install (either option):
brew install --cask mac-performance-monitor
Or grab MacPerformanceMonitor.pkg from Releases and double-click to install.
Build from source:
git clone --branch main https://github.com/Zesty0wl/mac-performance-monitor.git
cd mac-performance-monitor
swift build
swift test
Scripts/run.sh
Minimal working example:
- Open the app and pick a suitable sample granularity under Settings > Recording (the default is fine for daily use);
- Click the menu bar icon for live readings; long-press or right-click to reach Dashboard / Explorer;
- To review a stutter, "pin" the event moment in Explorer, overlay the relevant processes, then export a CSV for your teammates.
Advanced tips: to use an AI agent, install the MCP first (command above), then decide which slice of history to hand over — what the agent reads is what it sends.
8. Summary and next steps
Mac Performance Monitor's core value fits in one sentence: put "the Mac now" and "the Mac back then" in the same window, and keep all of it on the machine. If "I can't find the culprit behind a performance problem" is already giving you a headache, install a copy and let it record in the background for a few days; the next time the Mac stutters, open Explorer and dig up the cause like reviewing security footage.
- Repository: https://github.com/Zesty0wl/mac-performance-monitor
- Website: https://macperformancemonitor.com
- Docs: https://github.com/Zesty0wl/mac-performance-monitor/blob/main/docs/README.md
- Install:
brew install --cask mac-performance-monitor
If you've had enough of "it stuttered and I have no evidence", give it a try — it's free, open source and zero-telemetry anyway.
#mac-performance-monitor #MacPerformanceMonitor #zesty0wl #CLITool #DevTools #Database #OpenSource #GitHub