
1. Why you need this tool
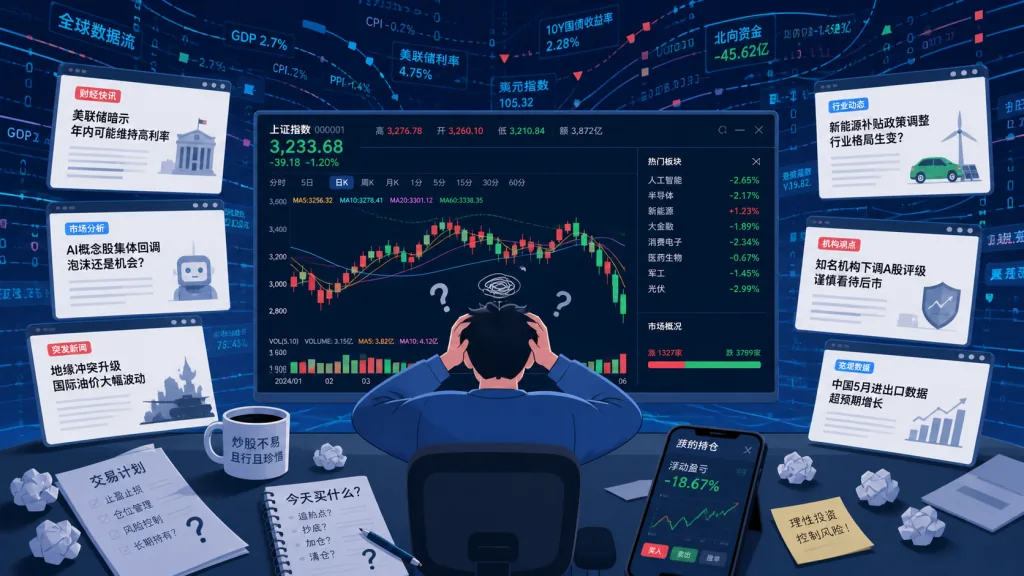
If you've ever stared at a candlestick chart, you know the feeling: the stock suddenly dumps 8%, and you're glued to the screen asking what happened. Was it an earnings miss, bad sector news, or big money heading for the exit? News is scattered across a dozen platforms, filings hide inside the official disclosure system, and broker research sits behind a paywall. By the time you assemble the whole picture, half an hour is gone — and the price has already recovered.
For retail investors, the chart only shows the result and hides the cause somewhere in an ocean of information. That's the pain point PokieTicker targets: pin the news directly onto the chart, so every price move can be traced back to a specific event.
2. What it is, in one line
PokieTicker is an event-driven stock analysis tool built around a single idea: candlestick chart + news + AI interpretation, all in one. An XGBoost model combines news sentiment with technical indicators to predict direction over T+1, T+3 and T+5 windows, and the frontend renders interactive charts with D3.js.
Key features at a glance:
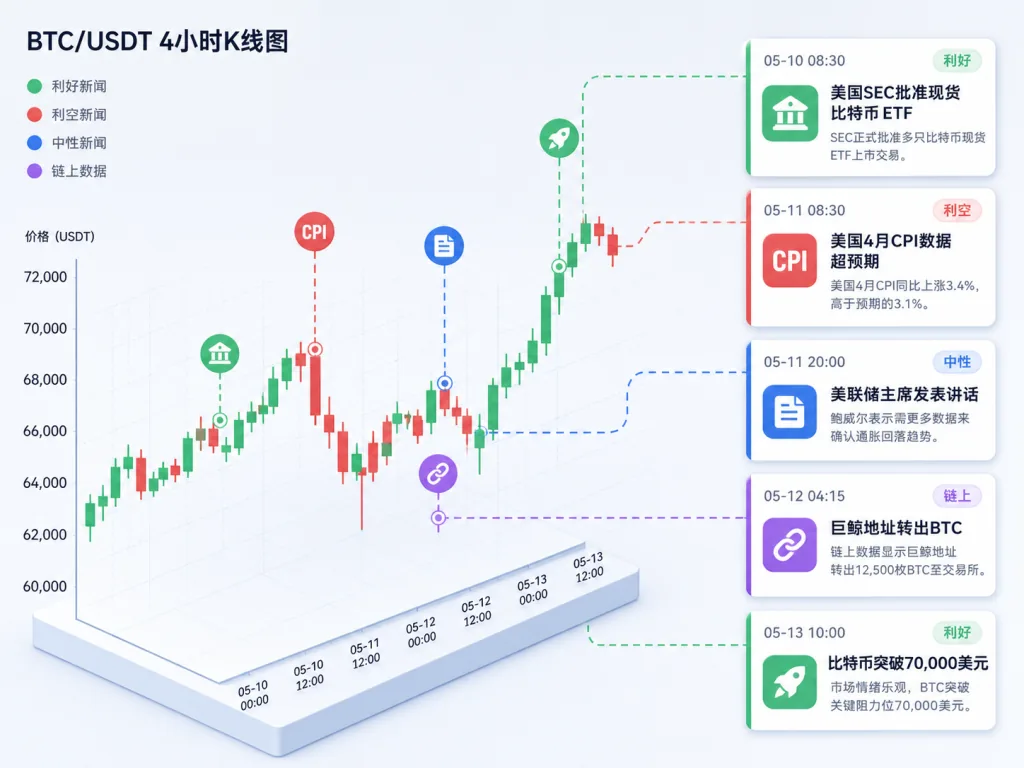
- News markers on the chart: every trading day is annotated with news events, click to see details
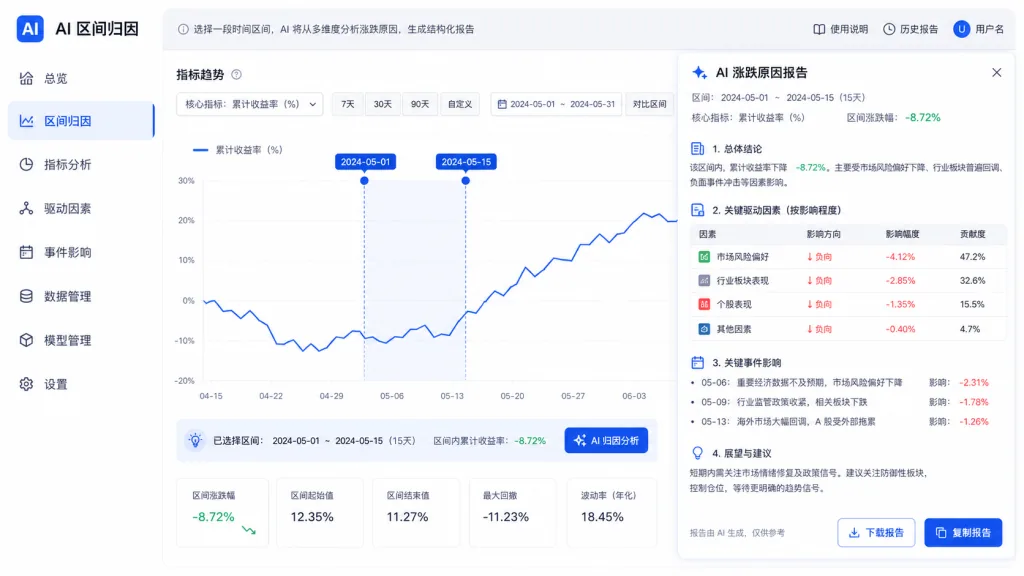
- AI attribution: pick a date range and let AI explain the move
- Historical analogy matching: cosine similarity finds past periods with a similar density of news
- Multi-horizon forecasts: 7-day and 30-day trend predictions
As of now the repo has 815 stars, is open source under MIT, and runs on React + TypeScript + FastAPI + XGBoost with 51K+ OHLC rows and 61K+ news items baked in — ready to use out of the box.
3. A close look at the core features
1. News markers on the candlestick chart
Traditional quote software shows you four numbers, OHLC. PokieTicker stacks news dots above each candle. Click a dot and the side panel immediately lists that day's news, sorted by sentiment score, each with a short "why it went up" / "why it went down" summary.
The design borrows from event-driven thinking: the price is the effect, the event is the cause. Pinning the cause next to the effect lets your eyes build causal intuition in one glance — especially friendly to beginners.
2. Filter news by impact type
The project ships six built-in categories: market sentiment, earnings, product, policy, competition and management changes. Click any category and the chart keeps only the matching events, labeled bullish or bearish. Filter for "earnings", for instance, and you can quickly locate how the price reacted around every past earnings release.
3. Historical analog search
The system converts each day's news profile (sentiment score, negative ratio, topic keywords) into a vector and computes cosine similarity against every historical trading day in the database. The top N matches show up in a "Similar Days" panel, annotated with what actually happened over the following 1, 3 and 5 days.
It's effectively a lightweight "learn from history" mechanism: when today brings three negative earnings stories clustered together, the system tells you how much the stock fell on average after similar setups in the past.
4. AI range attribution
Drag-select a date range on the chart and a "why did it fall / rise?" dialog appears; the backend calls Claude Sonnet to analyze all the news in that window and returns a structured attribution report. This layer is strictly on-demand, at roughly $0.003 per call.
4. Technical highlights and performance data
Feature engineering uses 31 dimensions, split into two blocks:
- News features (13): article count, sentiment score, positive/negative ratio, 3/5/10-day rolling means, sentiment momentum
- Technical features (18): 1/3/5/10-day returns, volatility, volume ratio, RSI-14, moving-average crossover signals
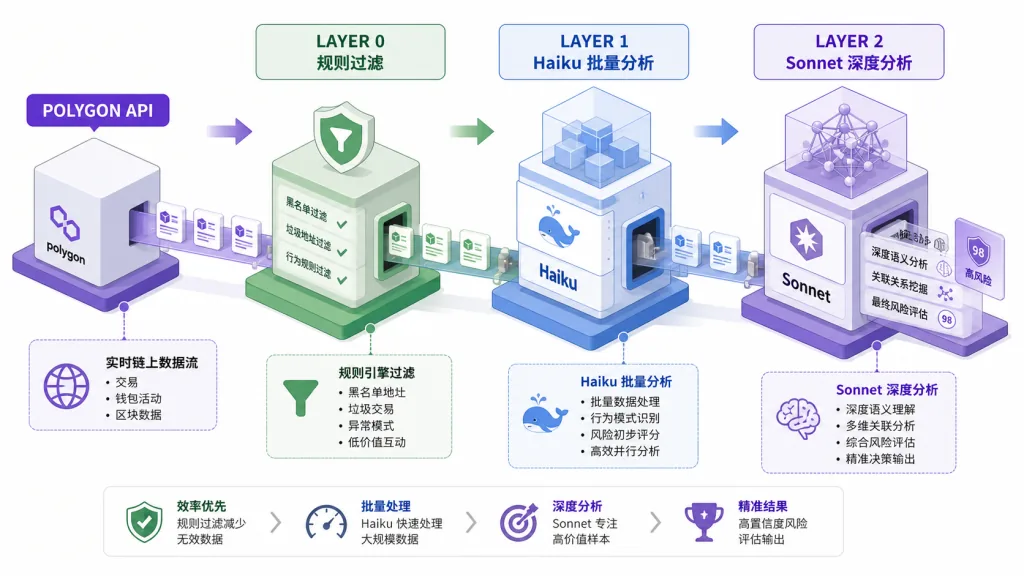
The data pipeline uses a three-layer architecture:
- Layer 0: rule-based filtering of junk and listicle content, free tier, roughly 17% rejection rate
- Layer 1: Claude Haiku batch API, 50 articles per batch, about $0.35 per thousand articles
- Layer 2: Claude Sonnet on-demand deep analysis, $0.003 per article
The prediction engine is an XGBoost classifier modeled separately for T+1, T+3 and T+5 horizons. Backtests show short-horizon direction accuracy beats a random baseline, but the author states plainly that this is an experimental learning tool, not investment advice.
On architecture: React + Vite + D3.js on the frontend, FastAPI + SQLite (WAL mode) on the backend, roughly 30 modules across the stack with clean separation of concerns.
5. Use cases and audience
Case 1: beginners building intuition
A chart paired with news markers is immersive teaching. A newcomer can grasp within 30 minutes what terms like "earnings beat" or "guidance cut" actually do to a stock.
Case 2: reviewing past moves
When you want to study the key turning points of a stock over the past year, the event annotations plus similar-day search get you to the decision moments fast.
Case 3: prototyping quant research
The repo includes a backtesting harness (backtest.py) and the feature engineering code, so quant hobbyists can quickly validate strategies of the "news sentiment × technical indicator" kind.
Fits: stock beginners, quant hobbyists, researchers interested in event-driven strategies.
Doesn't fit: intraday traders who need real-time tick data, institutional investors chasing high Sharpe, and speculators looking for a get-rich formula.
6. Comparison with alternatives
| Tool | News overlay | AI attribution | Prediction model | Open source | Learning cost |
|---|---|---|---|---|---|
| PokieTicker | ✅ Pinned to candles | ✅ Sonnet deep analysis | ✅ XGBoost T+1/T+3/T+5 | ✅ MIT | Medium |
| TradingView | ❌ Manual annotations | ❌ | ❌ | ❌ | Low |
| FinGPT | ❌ | ⚠️ Sentiment score only | ⚠️ Experimental | ✅ | High |
| Eastmoney | ❌ Separate news panel | ❌ | ❌ | ❌ | Low |
Compared with TradingView's pure chart view, PokieTicker folds the news into the chart itself; compared with FinGPT's pure-text route, it offers end-to-end visualization and backtesting.
7. Getting started fast
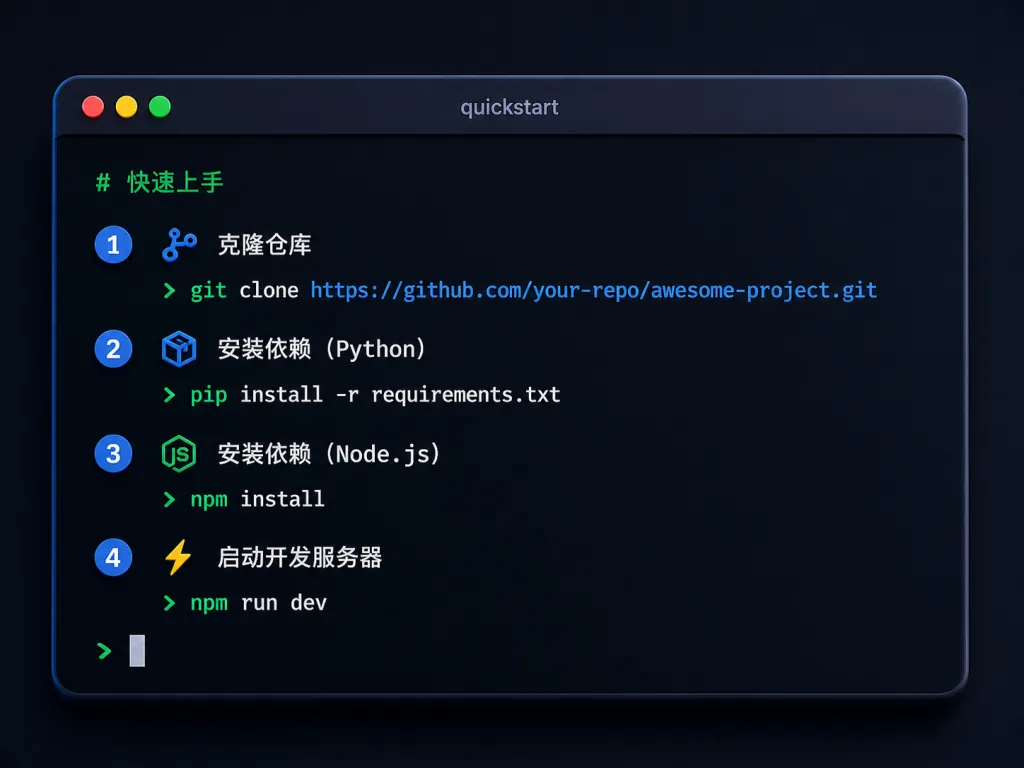
The repo ships a prebuilt database (pokieticker.db.gz), so you can try the full feature set without any API key:
git clone https://github.com/owengetinfo-design/PokieTicker.git
cd PokieTicker
gunzip -k pokieticker.db.gz
tar xzf models.tar.gz -C backend/ml/
python -m venv venv
source venv/bin/activate
pip install -r requirements.txt
cd frontend && npm install
Start the two services:
# Terminal 1: backend
uvicorn backend.api.main:app --reload
# Terminal 2: frontend
cd frontend && npm run dev
Then open http://localhost:7777/PokieTicker/ in your browser.
Further tips: to hook up live data, copy .env.example and fill in Polygon.io (free tier) plus an Anthropic API key, then run python -m backend.weekly_update every week for incremental updates — about $1–2 per week overall.
8. Takeaways and next steps
PokieTicker's core value is making price moves explainable. It folds fragmented news, AI interpretation and quant forecasts into one interactive interface, which is genuinely good training for event-driven thinking. Three levels of adoption:
- Start: try the online demo at mitrui.com/PokieTicker, no deployment needed
- Go deeper: run the repo locally and explore the full 51K+ dataset
- Go all in: plug in your own API keys and run the complete data pipeline with custom model training
Project links:
- GitHub: https://github.com/owengetinfo-design/PokieTicker
- Live demo: https://mitrui.com/PokieTicker
- License: MIT
One-line pitch: if you want to read the story behind the candles, PokieTicker is the lightest, most complete open-source answer available today.