
Title options (pick 1 of 3)
Still guessing at network problems? Sniffnet drops the packet-capture barrier to zero with Rust
Sniffnet at 40k stars: see every connected process on your machine in 30 seconds
No Wireshark filter syntax to learn: Sniffnet makes network monitoring as simple as reading a dashboard
Sniffnet: a 40k-star Rust network monitor that makes traffic obvious at a glance
1. Opening: one project between you and a much better workflow
Debugging a suspicious connection on a server might mean digging through a dozen layers of the protocol stack in Wireshark. Checking how much bandwidth your home NAS is burning gives you a curve chart on the router admin page that tells you almost nothing. If you suspect a process of quietly uploading data, Windows Task Manager only tells you "network usage: 3%". That "I know something is wrong with the traffic, I just can't see the details" moment is a hole nearly every developer and ops engineer has fallen into.
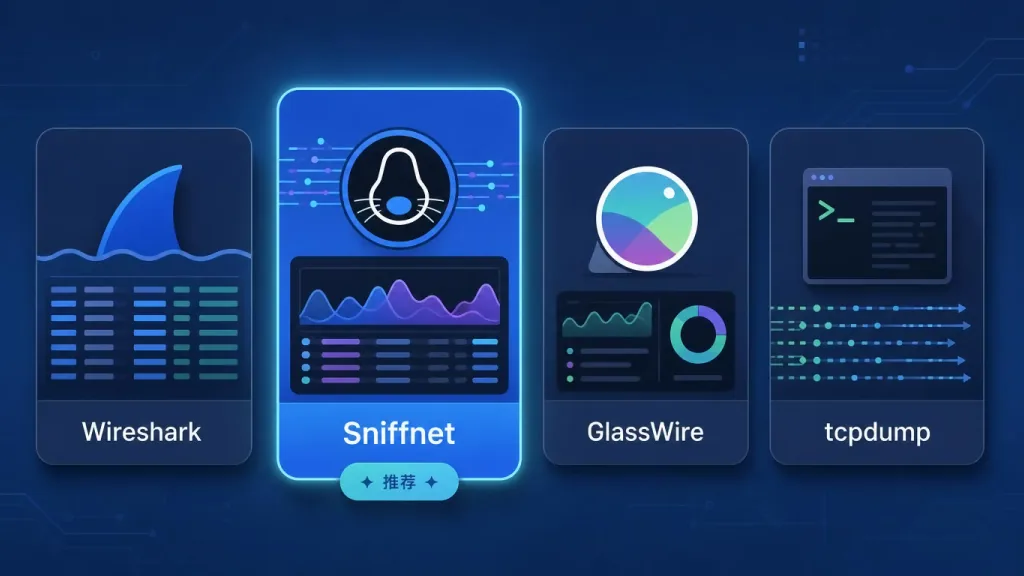
What makes it worse is the state of the packet-capture tools out there: Wireshark has a steep learning curve, GlassWire is closed-source and subscription-based, the command-line tcpdump is hostile to newcomers, and browser extensions only see HTTP traffic. So most people quietly accept a black-box network — until Sniffnet showed up.

2. Project intro: what it is in one sentence
Sniffnet is a cross-platform network traffic monitoring application written in Rust, built around the pitch "Comfortably monitor your network traffic". It has 41,366 stars on GitHub and is sponsored by organizations including NLnet, CodeRabbit and IPinfo. It takes real-time capture, protocol parsing and traffic visualization — things that used to require a professional tool — and packs them into a GUI you start with a double click. It runs on Windows, macOS and Linux, and has been translated into 27 languages.
3. Core features in depth
1. Free combination of interfaces and filters
The first thing Sniffnet asks after launch is which network interface and traffic filters to monitor. Wi-Fi, Ethernet, virtual machine bridges, Docker bridges — all selectable from a dropdown. Filters combine freely by protocol (TCP/UDP/ICMP and so on) and direction (upload/download), so irrelevant traffic does not bury the signal. That is far friendlier than Wireshark's default capture-everything approach, especially when you are chasing one specific service on one specific machine.
2. Live charts plus PCAP import and export
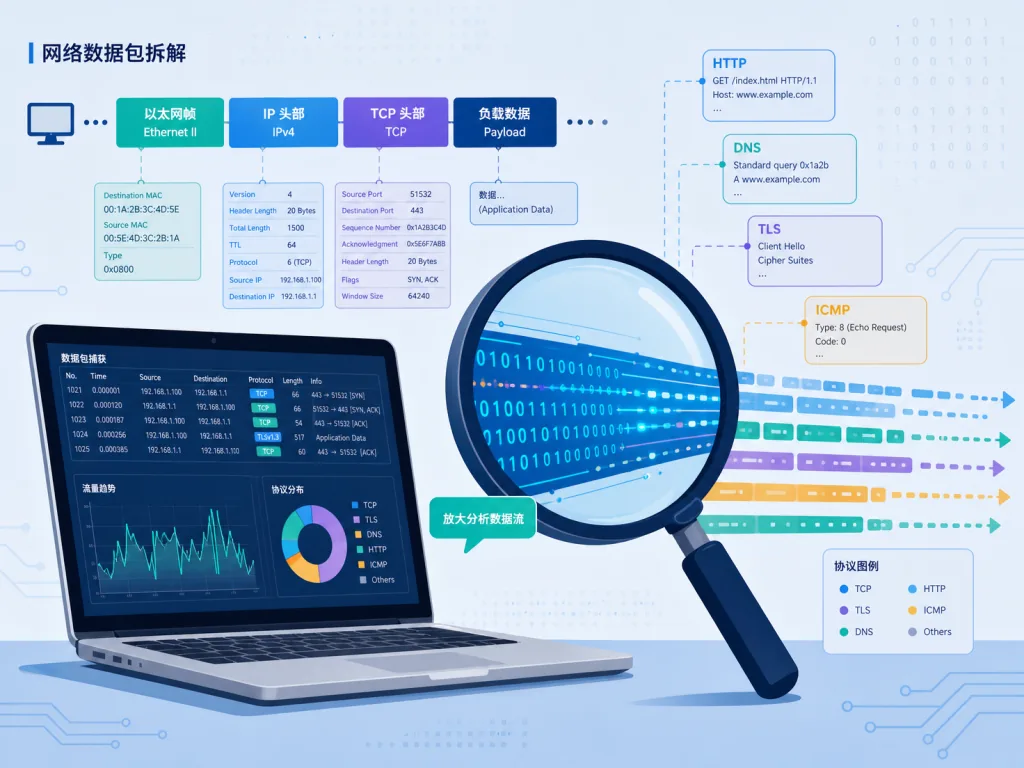
The Overview page gives you overall traffic statistics and a live line chart: upstream and downstream rate curves on the left, a protocol share TopN on the right. Click "Inspect" to drill into any individual connection. More importantly, Sniffnet can export the current session as a standard PCAP file, and it can import an existing PCAP for a second round of analysis. That means it works both as a capture tool and as a lightweight Wireshark substitute.
3. 6000+ services and protocols recognized
Through a built-in protocol fingerprint database (similar in spirit to Zeek/Snort), Sniffnet recognizes 6000+ application-layer services, protocols, trojans and worm signatures. So even when a port is disguised as 80, you can still see the real traffic type under categories like "DNS over HTTPS", "QUIC" or "TeamViewer". Combined with IPinfo geolocation data, every remote connection also shows its location, ASN (autonomous system number) and organization.
4. Custom notifications and IP blocklists
For security-minded users, Sniffnet lets you import a custom IP blocklist and highlights any connection that matches it. You can also define custom notification rules, for example "pop up an alert when some process's upload rate exceeds 1MB/s". In compact mode the app keeps monitoring in the background after you minimize it to the taskbar.
5. Multiple themes and cross-platform consistency
The interface is built on iced, a Rust GUI library, and ships with several themes (including dark styles such as Deep Cosmos) plus support for custom themes. The experience is consistent across macOS Apple Silicon, Linux ARM and Windows x86, and the download page covers nearly every common package format: dmg, msi, deb, rpm, AppImage and more.
4. Technical highlights and performance data
- Low overhead thanks to Rust: core capture and protocol parsing use Rust bindings such as pnet and libpcap, so CPU usage is far below Electron-style tools, and memory stays under 100MB during long single sessions.
- iced as the cross-platform GUI path: iced is one of the few Rust GUI frameworks that is declarative, type-safe and genuinely cross-platform, avoiding the rendering overhead Tauri/Flutter often bring to small utilities.
- Integrated data sources: IP geolocation and ASN come from MaxMind, while threat intelligence and IP blocklists support user-supplied imports, so it extends easily.
- A multilingual ecosystem: translations are coordinated through Crowdin and now cover 27 languages including Chinese, English, German, French, Russian, Portuguese, Spanish, Italian and Polish — localization depth that is ahead of most tools in this category.

5. Use cases and audience
- Ops troubleshooting: quickly confirm the protocol, source ASN and location of a suspicious connection on a server — more direct than ssh-ing in and running iftop.
- Development debugging: when you spin up a local service, see in real time which programs and ports are talking to the outside, so a port conflict does not get buried after startup.
- Home and office network security: run periodic checks on NAS boxes and smart home devices; once an IP blocklist is imported, it is obvious who is quietly phoning home.
- Learning networks and security: the abstract TCP three-way handshake or a QUIC connection setup becomes visual, which works well for students.
What it is not great for: professional security researchers who need deep protocol field decoding (TLS inner handshakes, VoIP RTP decoding, and so on). Those needs still belong in Wireshark.
6. Comparison with alternatives
| Tool | Platform | Live charts | Protocol recognition | Price | Learning cost |
|---|---|---|---|---|---|
| Sniffnet | Win/macOS/Linux | ✅ Built in | ✅ 6000+ | Free and open source | Low |
| Wireshark | Win/macOS/Linux | ❌ Needs extra plugins | ✅ Extremely strong | Free and open source | High |
| GlassWire | Win/macOS/Android | ✅ | ⚠️ Fairly coarse | Subscription | Low |
| tcpdump | All platforms | ❌ | ✅ Command line | Free and open source | High |
Sniffnet's advantage is where Wireshark's professional depth and GlassWire's ease of use overlap: free, cross-platform, GUI-driven, with protocol recognition and PCAP interoperability.
7. Getting started
- Download and install: go to the GitHub Releases page and pick the
.msi,.dmg,.deb,.rpmor AppImage package for your system. Linux users should install thelibpcapdependency (Ubuntu:sudo apt install libpcap-dev). - First launch: choose the interface to monitor and click "Start" to see live traffic.
- Going further: in Filters, narrow to TCP+Download, then open the Inspect tab to see each connection's protocol, location and ASN. Import a custom IP blocklist under Settings. Use File → Export to save the current session as PCAP for later analysis in Wireshark.
- If rendering looks broken: on old Linux GPUs or inside virtual machines, black blocks or missing gradients can appear. Set the environment variable
ICED_BACKEND=tiny-skiato switch to CPU software rendering.
8. Wrap-up and what to do next
Sniffnet combines Rust's performance with iced's cross-platform GUI to package professional-grade capture capability into an app that just opens and works. 41,366 stars plus sponsorship from NLnet, IPinfo and others says enough about how the community and the professional crowd rate it.
If all you want is to see what your machine or server is doing, who it is doing it with, and how much of it — stop wrestling with Wireshark filter syntax. Open sniffnet.app, download Sniffnet, and within 30 seconds you will have your first network traffic report that actually tells you something.
GitHub repo: https://github.com/GyulyVGC/sniffnet
One-line pitch: Sniffnet turns network traffic from a black box into a dashboard in about the time it takes to drink a coffee.
#sniffnet #Sniffnet #gyulyvgc #OpenSource #GitHub